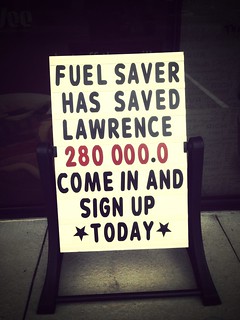
 The photo in this post is from a gas station at a local grocery store. They put up a sign at the gas station showing how much money they saved a community via their fuel points program.
How cool would that be to use one of those library value calculators, add everything up for a year, and share how much money the library has saved the community – in books, videos, and events attended?
For some libraries, this could be a really BIG number!
Why do this? I can think of a few reasons, including:
- It puts a positive spin on library budget discussions
- It’s a nice way to share what the library does
- It changes the conversation from an internal library one (i.e., how many books were checked out) to a community-facing, “why should I care” one
- It’s a handy way to share the value of a library without having to explain why all those circulation statistics and customer count numbers matter
Has anyone done something like this before? If so, did it work? I’d love to know – please share!
 Somebody recently asked me about Twitter for their library (which lead to my last post and this one). As I was answering her question about social media strategy, I said (a version of) this:
 This sign was at our local shopping mall. Like any good blogging geek, I stopped and took a picture of it – to the chagrin of my kids, I’m sure (“Mom – Dad’s taking pictures of signs again!†– eye roll!)
 [This is an article I wrote for my book,